
Spotflow automatically collects system metrics from your devices: CPU utilization, heap usage, stack pressure, MQTT connection state, reset causes. These built-in metrics are valuable for detecting memory leaks before they cause crashes, or spotting a CPU spike introduced by a firmware update.
But for most connected products, system health is only part of what you need to understand.
You also care about what your device is actually doing in the field. How many times was the door unlocked today? Which unlock method are users reaching for most? How long does an NFC authentication take, and does that change between firmware versions? Is battery drain correlated with a specific user workflow?
This post walks through Spotflow’s Custom Metrics and Custom Dashboards features using a smart lock fleet as a running example. By the end, you will know how to define and report application-specific metrics from Zephyr or any MQTT-capable device, and how to build dashboards that go beyond infrastructure monitoring into product analytics.
Key Takeaways
- Custom Metrics let you track application-specific data (sensor readings, operation durations, button presses, business events) alongside built-in system telemetry.
- Zephyr integration is a few lines of C: register a metric handle at startup, report values from anywhere in your application. The SDK handles aggregation, encoding, and MQTT transmission.
- MQTT integration works for any platform (FreeRTOS, bare metal, ESP-IDF, Linux): publish a payload to a single topic.
- Labels add dimensions to a metric: each unique combination of label values creates a separate time series with independent aggregation. You declare the label keys once when registering the metric and supply their values with each report.
- Custom Dashboards give you product-specific views with tailored queries, filters, and groupings. The same pipeline that powers operational monitoring also powers product analytics.
The Limits of System Metrics Alone
Spotflow collects a set of system metrics automatically when you enable CONFIG_SPOTFLOW_METRICS_SYSTEM=y on Zephyr. These include:
cpu_utilization_percent: CPU load over timeheap_free_bytes/heap_allocated_bytes: memory pressurethread_stack_free_bytes/thread_stack_used_percent: per-thread stack headroomnetwork_tx_bytes/network_rx_bytes: network traffic per interfaceboot_reset: reset causes and reasonsuptime_ms: device uptime heartbeat
These metrics are surfaced automatically in the built-in Device Dashboard and Overview Dashboard. They answer the question: Is the device healthy?
What they do not answer is: What is the device doing, and how are users interacting with it?
For a smart lock, you might deploy a firmware version that looks perfectly healthy by all system metrics (no crashes, stable CPU, heap well within limits) but still have users reporting that NFC unlocks feel slow, or that Bluetooth pairing started failing on a subset of devices after the latest OTA. These issues are invisible to system telemetry. They require application-level instrumentation.
A Concrete Example: Smart Lock Fleet
Imagine you operate a fleet of smart locks deployed across a portfolio of commercial buildings. Each lock runs firmware on a low-power ARM Cortex-M33 MCU with Bluetooth, NFC, and keypad input, connected to the cloud via MQTT over TLS.
The device has several key behaviors you want to observe from the cloud:
- Operation duration: how long does a lock or unlock operation take, broken down by method (NFC, keypad, Bluetooth)?
- Door events: how many times per hour is the door actually opened?
- Battery level: what is the current battery percentage, and is it draining faster on certain devices or deployments?
- Authentication failures: how often do users fail to authenticate, and with which method?
None of these are captured by system metrics. They require custom metrics defined in your application. The smart_lock_fleet sample on GitHub is the complete runnable project used as the basis for the code in this post.
Reporting Custom Metrics from Zephyr
If your device runs Zephyr RTOS (or Nordic nRF Connect SDK), the Spotflow module handles aggregation, encoding, and MQTT transmission automatically. You register metric handles at startup and report raw values from your application. The SDK does the rest.
Enable Metrics in Kconfig
Make sure the Spotflow module and metrics subsystem are enabled in your prj.conf:
CONFIG_SPOTFLOW=y

# Enable custom (and optionally system) metrics
CONFIG_SPOTFLOW_METRICS=y
# Optional: auto-collect CPU, heap, stack, etc.
CONFIG_SPOTFLOW_METRICS_SYSTEM=y
CONFIG_SPOTFLOW_METRICS_SYSTEM is independent of custom metrics. You can enable both together, or skip system metrics and use only custom metrics. Your choice.
Before integrating your device with Spotflow, make sure you have established a connection to the internet from the device.
Include the Metrics Header
In your application source file, include the Spotflow metrics API:
#include "metrics/spotflow_metrics_backend.h"Register Your Custom Metrics
Register each metric before reporting any values. Registration binds a metric name and aggregation interval to a typed handle used for all subsequent reports.
In the smart lock sample, the three lock metrics are registered together in init_lock_metrics() in lock.c, called once from main() after the network is up:
/* Handles - module-level statics in lock.c */
static struct spotflow_metric_float *g_op_duration_metric;
static struct spotflow_metric_int   *g_door_opened_metric;
static struct spotflow_metric_int   *g_auth_failure_metric;

int init_lock_metrics(void)
{
    int rc;

    /*
     * lock_operation_duration_ms: float, 1-minute aggregation.
     * max_timeseries = 6: 2 operations (lock/unlock) x 3 methods = 6 label combinations.
     * max_labels = 2: "operation" and "method".
     */
    rc = spotflow_register_metric_float_with_labels(
        "lock_operation_duration_ms",
        SPOTFLOW_AGG_INTERVAL_1MIN,
        6,  /* max_timeseries */
        2,  /* max_labels */
        &g_op_duration_metric);
    if (rc < 0) {
        LOG_ERR("Failed to register lock_operation_duration_ms: %d", rc);
        return rc;
    }

    /*
     * door_opened: int, no aggregation.
     * Every door open event is transmitted immediately as a discrete data point.
     */
    rc = spotflow_register_metric_int(
        "door_opened",
        SPOTFLOW_AGG_INTERVAL_NONE,
        &g_door_opened_metric);
    if (rc < 0) {
        LOG_ERR("Failed to register door_opened: %d", rc);
        return rc;
    }

    /*
     * auth_failure: int, no aggregation, labeled by method.
     * max_timeseries = 3: one series per method (nfc, keypad, bluetooth).
     * max_labels = 1: "method".
     */
    rc = spotflow_register_metric_int_with_labels(
        "auth_failure",
        SPOTFLOW_AGG_INTERVAL_NONE,
        3,  /* max_timeseries */
        1,  /* max_labels */
        &g_auth_failure_metric);
    if (rc < 0) {
        LOG_ERR("Failed to register auth_failure: %d", rc);
    }

    return rc;
}
The battery metric is registered differently: inside the battery monitor thread itself. Registering the metric in the same source file and thread where it will be used keeps the handle and reporting loop together, with no external dependency. The thread is started automatically at boot via K_THREAD_DEFINE; the metric registration happens when the thread first runs:
static struct spotflow_metric_float *g_battery_metric;

static void battery_thread_entry(void)
{
    int rc = spotflow_register_metric_float(
        "battery_level_percent",
        SPOTFLOW_AGG_INTERVAL_NONE,
        &g_battery_metric);
    if (rc < 0) {
        LOG_ERR("Failed to register battery_level_percent: %d", rc);
        return;
    }

    while (true) {
        float level = read_battery_percent();
        spotflow_report_metric_float(g_battery_metric, level);
        k_sleep(K_MSEC(BATTERY_REPORT_INTERVAL_MS)); /* every 5 minutes */
    }
}

K_THREAD_DEFINE(battery_thread, BATTERY_THREAD_STACK_SIZE,
                battery_thread_entry, NULL, NULL, NULL,
                BATTERY_THREAD_PRIORITY, 0, 0);
K_THREAD_DEFINE creates and starts the thread at system init, before main() runs. Registering the metric inside the thread entry keeps the handle and the reporting loop in the same translation unit, with no external dependency.
Choosing the Right Aggregation Interval
The aggregation interval is a registration-time decision: you choose it once when calling spotflow_register_metric_*, and it applies to every value reported through that handle. It is a trade-off between data granularity and bandwidth usage. Spotflow supports four options:
| Interval | Constant (Zephyr) | JSON value | Typical use case |
|---|---|---|---|
| No aggregation | SPOTFLOW_AGG_INTERVAL_NONE |
"0" |
Events, state changes, point-in-time readings where every sample matters |
| 1 minute | SPOTFLOW_AGG_INTERVAL_1MIN |
"1m" |
Operation durations, sensor readings where per-minute trends are sufficient |
| 1 hour | SPOTFLOW_AGG_INTERVAL_1HOUR |
"1h" |
Fleet health trends, long-running deployments, capacity planning |
| 1 day | SPOTFLOW_AGG_INTERVAL_1DAY |
"1d" |
Low-bandwidth deployments (LoRa, NB-IoT), daily usage summaries |
For the smart lock: door open events and authentication failures use no aggregation, so every occurrence is a distinct data point visible individually. Operation duration uses 1-minute aggregation, because you care about average latency trends and outliers, not each individual millisecond measurement. Battery level sampled every 5 minutes is sent raw here, but could be aggregated to 1-hour resolution if bandwidth is a concern.
When using the Spotflow device SDK (e.g. Zephyr), aggregation is computed on-device and the SDK transmits sum, count, min, and max as a single MQTT message at the end of each window.
Report Values from Application Code
Once registered, report values at any point from any thread. In lock.c, three static functions handle reporting and are called from simulate_lock_operation():
static void on_lock_operation_complete(const char *operation,
                                       const char *method,
                                       float duration_ms)
{
    struct spotflow_label labels[] = {
        { .key = "operation", .value = operation }, /* "lock" or "unlock" */
        { .key = "method",    .value = method    }, /* "nfc", "keypad", or "bluetooth" */
    };

    int rc = spotflow_report_metric_float_with_labels(
        g_op_duration_metric, duration_ms, labels, 2);
    if (rc < 0) {
        LOG_ERR("Failed to report lock_operation_duration_ms: %d", rc);
    }
}
Because this metric uses SPOTFLOW_AGG_INTERVAL_1MIN, the SDK accumulates all reported values within each one-minute window and transmits a single aggregated message (sum, count, min, max) at the end of the window. On a device reporting dozens of operations per minute, this reduces outgoing MQTT messages to one per minute per label combination, regardless of operation frequency.
For door opens and authentication failures, use the event API. An event is equivalent to reporting an integer value of 1 with no aggregation — it signals that something happened:
static void on_door_opened(void)
{
    int rc = spotflow_report_event(g_door_opened_metric);
    if (rc < 0) {
        LOG_ERR("Failed to report door_opened: %d", rc);
    }
}

static void on_auth_failure(const char *method)
{
    struct spotflow_label labels[] = {
        { .key = "method", .value = method },
    };

    int rc = spotflow_report_event_with_labels(g_auth_failure_metric, labels, 1);
    if (rc < 0) {
        LOG_ERR("Failed to report auth_failure: %d", rc);
    }
}
Battery level reporting lives entirely inside battery_thread_entry() shown above. The read_battery_percent() call is where your platform ADC read would go; in the sample it returns a simulated slowly-draining value. The rest of the thread is identical to what you would write on real hardware.
That is the complete application-side instrumentation. No Spotflow-specific logic leaks into your business logic paths. Just report a value when something happens, and the SDK takes care of the rest.
For the full Zephyr integration reference, see Metrics with Zephyr. The complete runnable project for this smart lock example is in the smart_lock_fleet sample on GitHub; the canonical minimal reference is the metrics sample.
The diagram below illustrates the full data flow inside the Zephyr SDK:
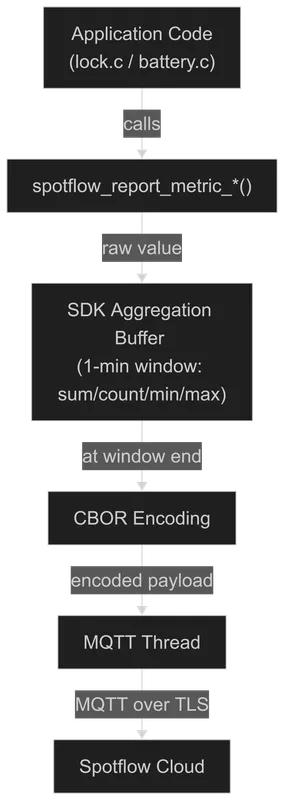 Zephyr metrics data flow: application calls spotflow_report_metric, SDK aggregates and encodes in CBOR, MQTT thread transmits to Spotflow over TLS.
If your device does not run Zephyr, custom metrics can be reported directly over MQTT from any platform (FreeRTOS, bare metal, ESP-IDF, Linux). Connect to mqtt.spotflow.io:8883 over TLS and publish JSON payloads to the ingest-json topic with metricName, sum, and optionally labels, aggregationInterval, count, min, and max. When using the MQTT integration directly, you construct the aggregated payload yourself. If no aggregation is needed, set the aggregation window to 0 and only the sum field is required (it represents the raw sample value). See Metrics with MQTT for the full payload schema.
Building a Custom Dashboard
Once metrics are flowing into Spotflow, you can build a custom dashboard to visualize them alongside or separately from the built-in device and fleet views.
Step 1: Create a New Dashboard
In the Spotflow portal, navigate to Dashboards and click + Create Dashboard. Give it a name, for example Smart Lock Fleet Analytics, and an optional description.
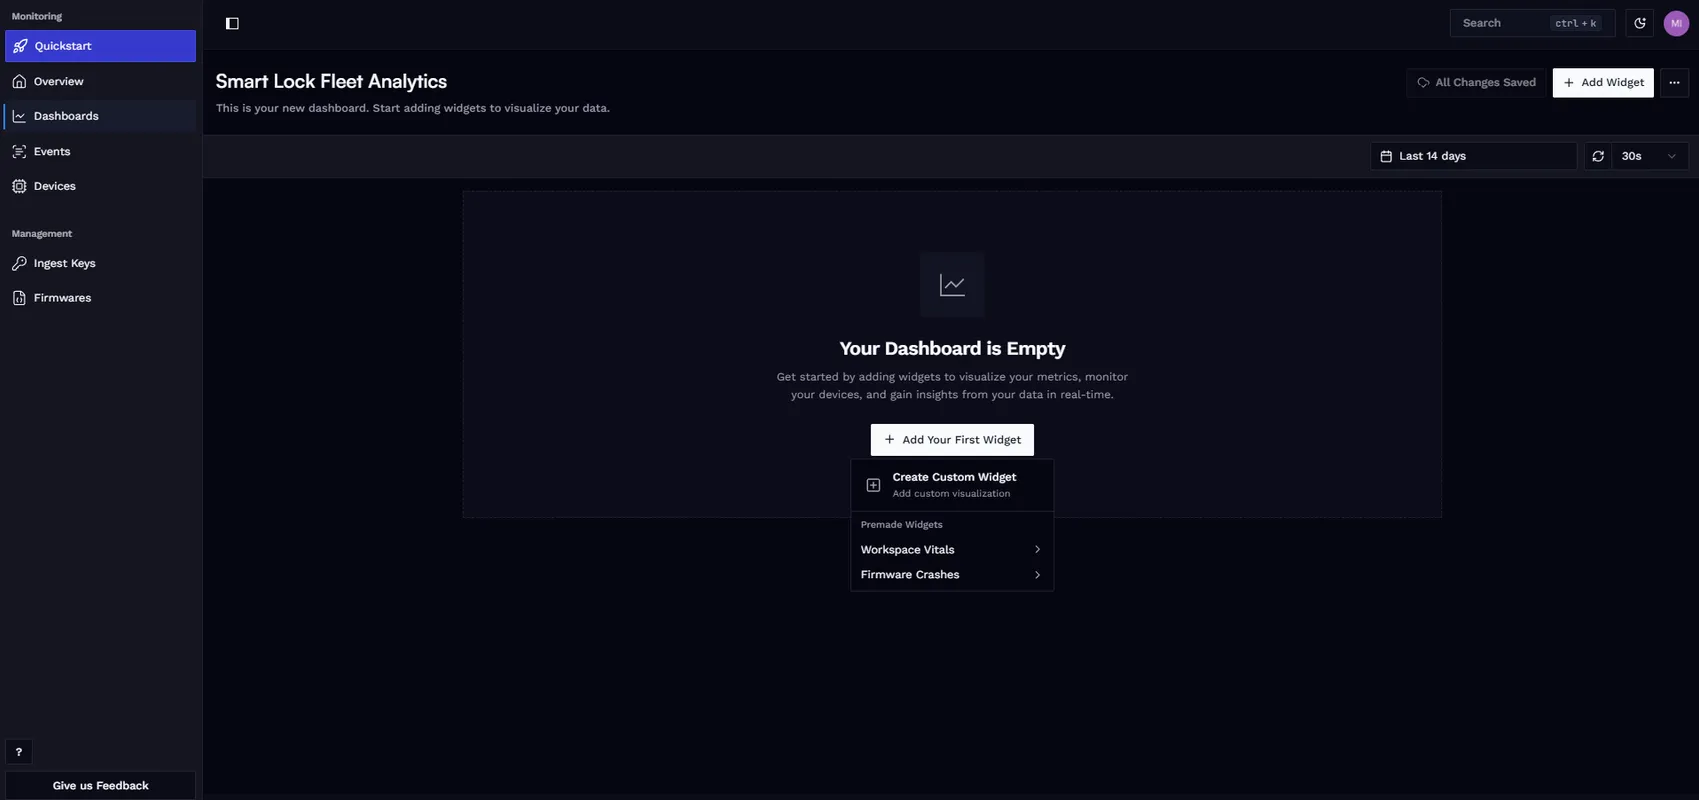
Step 2: Add a Custom Widget
Click Add Your First Widget and choose Create Custom Widget. The widget builder lets you configure:
- Metric name: the
metricNamestring used when registering or publishing (e.g.,lock_operation_duration_ms). - Aggregation function: how to combine values across the selected time range: average, sum, count, min, or max.
- Filters: restrict the query to a specific device ID, firmware version, or any label value. For example, filter by
firmware_version=2.3.0to isolate a specific rollout, or filter bydevice_id=12345to focus on a single device. - Group by: split the chart into separate series by a label value. Grouping
lock_operation_duration_msbymethodrenders three lines on the same chart (NFC, keypad, and Bluetooth) with no separate widgets needed. - Chart type and units: line chart, bar chart; milliseconds, percent, count, bytes.
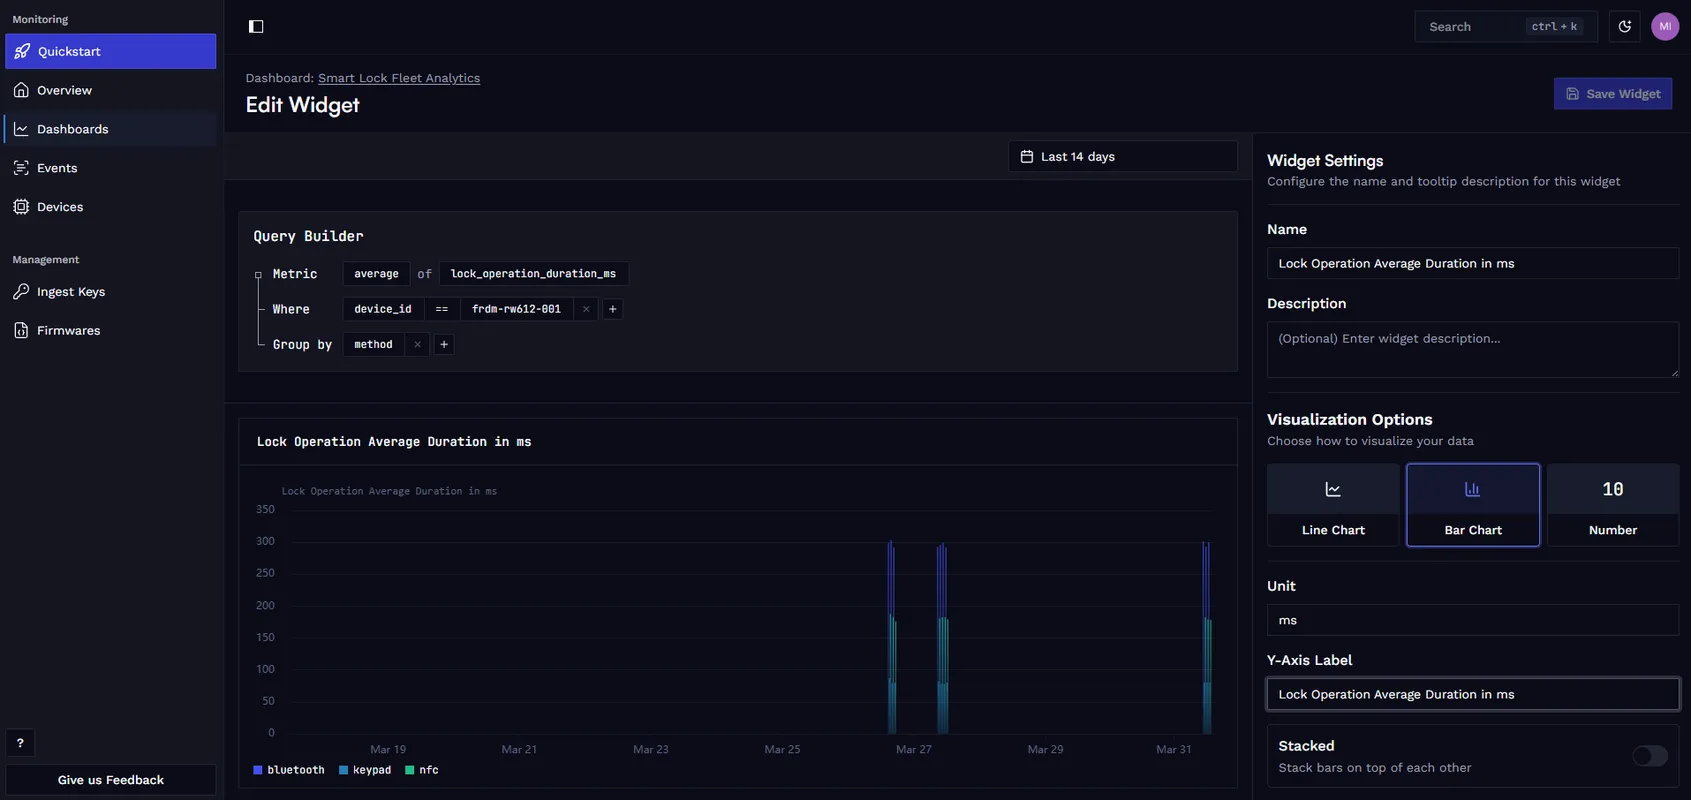
Step 3: Build the Full Dashboard
For the smart lock fleet, a useful analytics dashboard includes:
- Operation duration over time, grouped by
method: shows at a glance whether NFC is consistently slower than keypad, or whether a recent firmware update improved Bluetooth latency. - Door open events per hour: answers how actively the locks are being used throughout the day and week. Useful for identifying usage patterns and anomaly detection.
- Authentication failure rate, grouped by
method: highlights which authentication method is most error-prone and whether the failure rate changed after a firmware update. - Battery level across the fleet: identifies devices draining faster than expected, which can indicate a hardware issue or a power regression in firmware.
- Premade Spotflow widgets: add crash rate, firmware version distribution, and uptime alongside your custom widgets to keep operational health visible in the same view.
After saving, configure the time range (last 24 hours, 7 days, 30 days) and auto-refresh frequency. Widgets can be resized and renamed at any time, and you can create multiple dashboards for different audiences: one for the firmware team focused on latency and errors, another for product management focused on usage patterns.
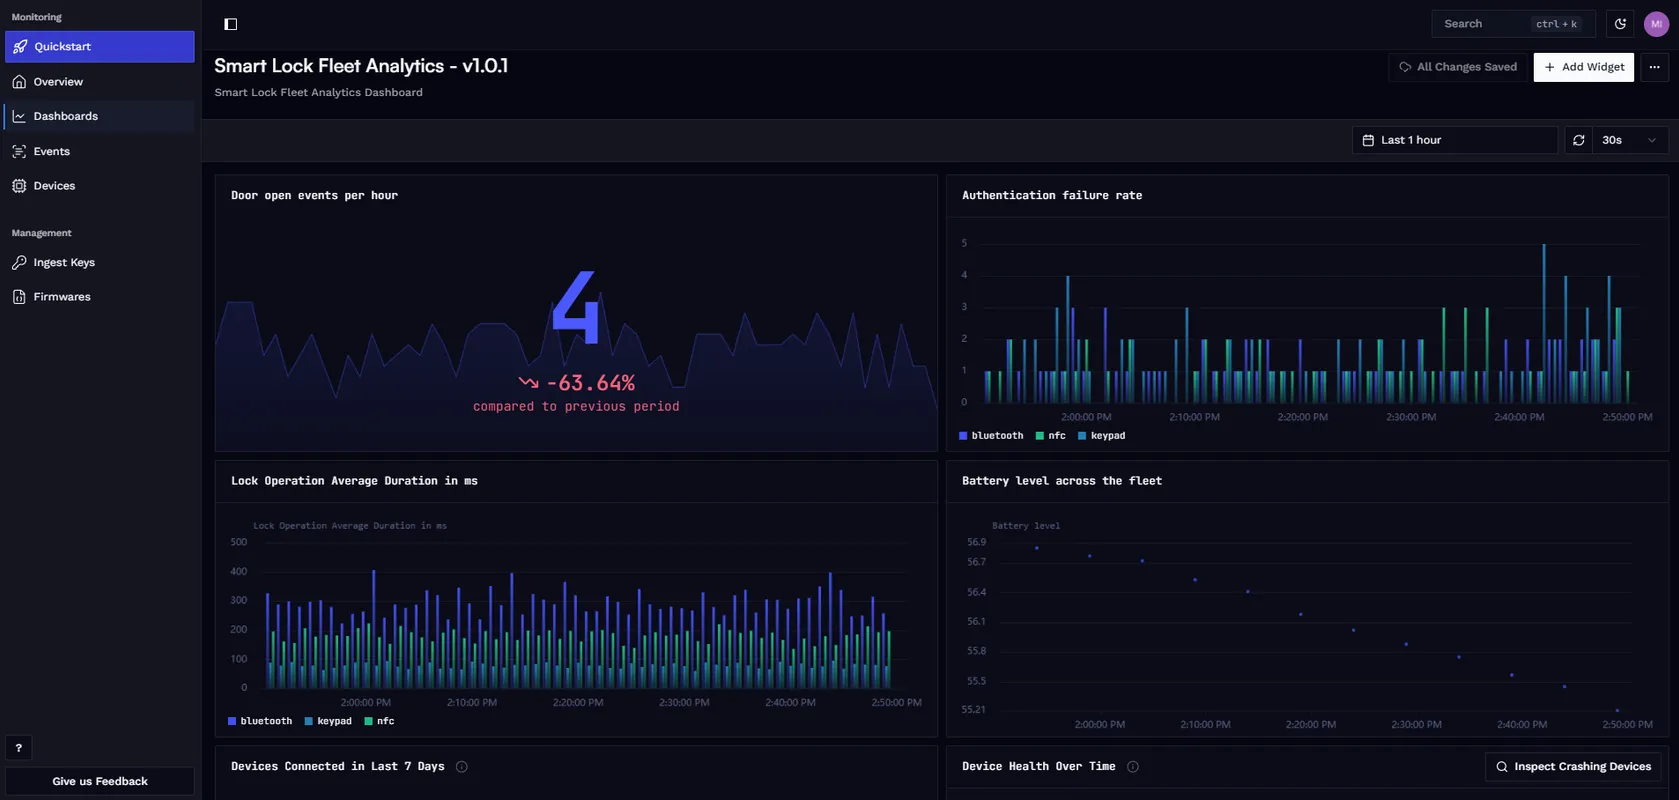
For step-by-step instructions, see Create Custom Dashboard.
Product Analytics: Business Insights from Firmware Data
Custom metrics are not limited to operational monitoring. The same pipeline (device reports a metric, Spotflow ingests and stores it, dashboard visualizes it) works equally well for product analytics.
For the smart lock product, the metrics you are already collecting to debug firmware issues also answer product questions:
- Feature adoption: Are users actually using NFC, or is keypad still dominant after 6 months? Has Bluetooth unlock adoption increased since you shipped the mobile app update? The
auth_failureanddoor_openeddata, broken down bymethod, tells you directly. - Usage patterns: When are locks most active? Are there usage spikes that map to shift changes? A fleet-wide aggregation of
door_openedevents over time reveals the usage shape of your product. - Firmware regression detection: Did operation latency increase after the v2.3.0 rollout? Add a
firmware_versionlabel tolock_operation_duration_msreports (or filter by it in the dashboard) and compare averages across firmware versions in the fleet. - Error rate trends: Is the
auth_failurerate climbing on devices that received the latest OTA update, or is it stable? Filtering by firmware version on the failure metric answers this without needing a separate error tracking system.
The key insight for embedded engineers: product analytics do not require a separate data infrastructure. The metrics your firmware reports for debugging and operational monitoring are the same metrics that can drive product decisions, as long as you instrument for both from the start.
A temperature sensor product becomes: “Which geographic regions are experiencing readings outside the expected range?” An industrial pump controller becomes: “How often is the pressure relief valve activating per installation, and has that changed with the latest control loop tuning?” A medical infusion device becomes: “What is the distribution of alarm acknowledgment times across hospitals?”
These questions are answered by the same custom metrics pipeline. The difference is what you choose to measure and how you label it.
Conclusion
Spotflow custom metrics let you go beyond built-in system telemetry and define the measurements that actually matter to your product. From sensor readings and operation durations to user interaction events, any application-level data point can be captured, aggregated on-device, and transmitted to Spotflow using the Spotflow device SDK (e.g. Zephyr) or via the MQTT integration directly.
Custom dashboards then let you build product-specific views of that data. Operational charts help you debug fleet issues; product analytics charts answer business questions. Both use the same infrastructure and the same metrics pipeline.
The smart lock example in this post illustrates the pattern, but the same approach applies to any connected embedded product: industrial sensors, medical devices, consumer electronics, agricultural monitors, automotive ECUs. If you can express what you want to know as a numeric measurement or a countable event, you can track it with Spotflow custom metrics.
Ready to get started? Sign up for Spotflow, no credit card required.
Explore the documentation to go deeper:
- Custom Metrics
- Custom Dashboards & Product Analytics
- Metrics with Zephyr
- Metrics with MQTT
- Create Custom Dashboard
- Metrics sample on GitHub
- Smart Lock Fleet sample on GitHub
Questions or feedback? Reach out on Discord or email hello@spotflow.io.